Widgets Page
The Widgets Page provides a consolidated overview of all containers at your mining site. Keep this page open at all times to monitor critical indicators across your entire operation.
For system architecture and how container data is aggregated, see Architecture — Rack System.
Overview
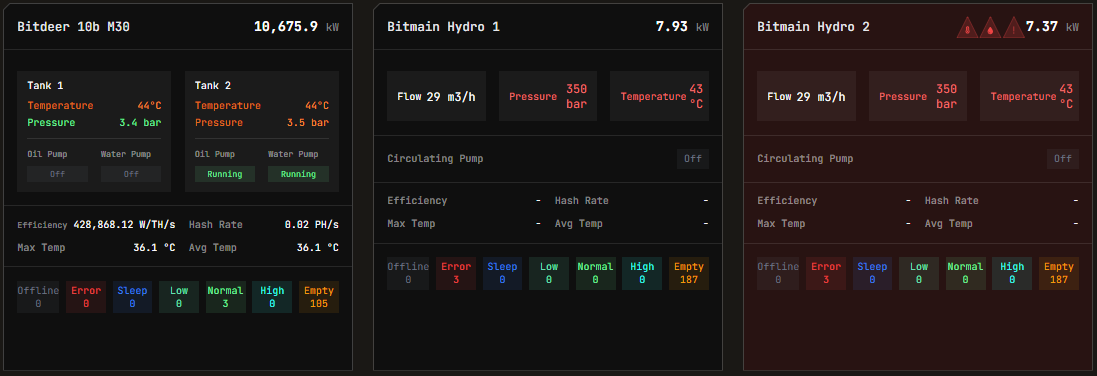
Miner statuses are updated every 1 minute. In case of an active alarm, the container's name in the widget will flash in red. For details on alarm severity and handling, see the Alerts Manual.
Key Indicators
These widgets identify relevant events such as:
- Errors in the electricity supply
- Power meters lost connection
- Water or oil pumps stop working
For complete alert definitions and troubleshooting procedures, refer to the Alerts Manual. For power meter specifications, see Supported Devices — Power Meters.
Efficiency Calculation
Depending on the site's electrical network, container efficiency is calculated based on:
- The container-wise power meter (if available), or
- The sum of the miner consumptions
When using miner consumption sums, data is not real-time (updated approximately every 1 minute). Treat this value as a rough estimate—it does not account for consumption of auxiliary devices such as air fans.
For more details on efficiency metrics, see the Header documentation and Dashboard. For nominal efficiency values by miner model, see Supported Devices.
Widget Navigation
Clicking on any widget navigates to that container's Home page. For container-specific documentation, see:
- Bitdeer Containers — See also Supported Devices — Bitdeer
- Antspace Hydro Containers — See also Supported Devices — Bitmain Antspace
Alert Icons
Widgets display alert icons by type (pressure, leakage, temperature, and others). Hover over an icon to see the alert description.
![]()
![]()
| Icon Type | Common Causes | Reference |
|---|---|---|
| Pressure | Coolant system issues, leaks, blockages | Visual Alerts per Container |
| Leakage | Pipe failures, seal degradation | Alerts Manual |
| Temperature | Cooling failures, environmental conditions | Heatmaps |
For temperature visualization across your fleet, see the Heatmaps documentation.
Related Documentation
- Header — Understanding header metrics and alerts summary
- Dashboard — Main dashboard and active incidents
- Explorer — Search and filter devices
- Alerts Manual — Alert types, severity levels, and troubleshooting
- Heatmaps — Temperature and hashrate visualization
- Operational Best Practices — Recommended monitoring procedures