Dashboard
Primary interface for fleet management, covering layout structure and inventory-specific components.
The Inventory Dashboard provides the primary interface for fleet management within MiningOS. This page explains the common layout structure shared across all MiningOS pages and the specific components of the Inventory Management Dashboard.
For the main operational dashboard, see Dashboard. For header bar documentation, see Header.
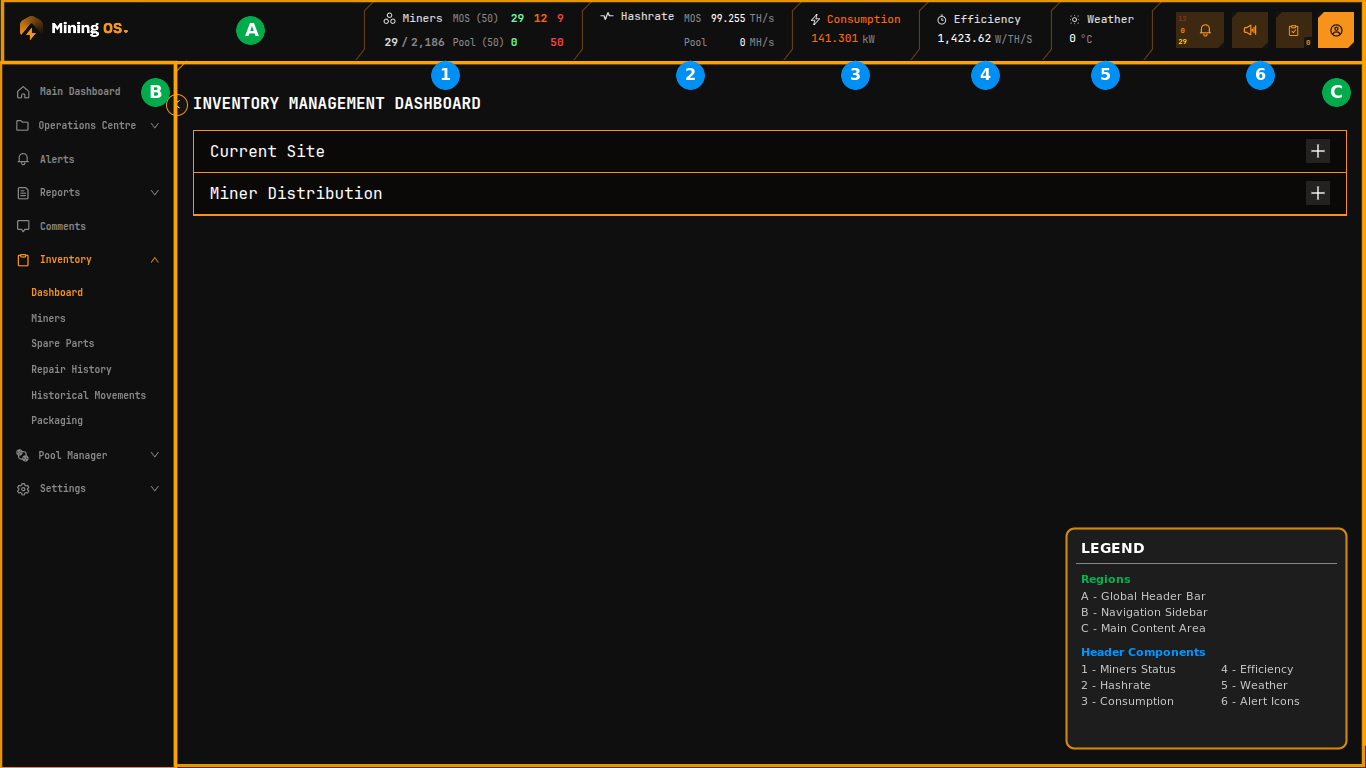 Figure 1: MiningOS interface layout showing main regions (A-C) and header components (1-6)
Region A: Global Header Bar
The header bar remains visible across all pages, providing persistent operational awareness. For complete header documentation, see the Header page.
 Figure 2: Global header bar showing real-time fleet metrics and alert indicators
Component 1: Miners Status
Displays fleet health through color-coded counts against total capacity:
| Value | Color | Meaning |
|---|---|---|
| 29 | Green | Online with normal operation or minor errors |
| 12 | Orange | Experiencing major errors requiring attention |
| 9 | Red | Offline or in sleep mode |
| MiningOS (50) | White | Total miners registered for this site |
| 29 / 2,186 | — | Active miners versus total container capacity |
The adjacent Pool indicator shows miners connected to mining pools. A green number indicates active connections; red with "0" indicates pool connectivity issues. See Pool Manager Module for pool configuration.
For detailed status definitions, see Header — Miners Status Indicators.
Component 2: Hashrate
| Metric | Description |
|---|---|
| MiningOS | Hashrate aggregated from device telemetry |
| Pool | Hashrate as reported by mining pool (shows 0 when disconnected) |
For hashrate monitoring and visualization, see Dashboard and Heatmaps.
Component 3: Consumption
Total power draw in kilowatts (kW) as measured by connected power meters. Displayed in orange to draw attention to power costs.
For power meter specifications, see Supported Devices — Power Meters.
Component 4: Efficiency
Power efficiency expressed as W/TH/s (watts per terahash per second). Lower values indicate better efficiency. This metric helps identify:
- Equipment degradation
- Suboptimal environmental conditions
- Cooling system issues
For efficiency monitoring guidelines, see Operational Best Practices.
Component 5: Weather
Current ambient temperature at the site location in degrees Celsius. Sourced from weather API integration via the OpenWeather worker.
For weather worker installation, see Installation — OpenWeather.
Component 6: Alert Icons
Quick-access filters for the Alerts page, organized by severity level. Each icon displays a count badge and links directly to filtered alert views:
| Severity | URL Pattern | Documentation |
|---|---|---|
| Critical | /alerts?severity=critical | Alerts — Severity Levels |
| High | /alerts?severity=high | Alerts — Severity Levels |
| Medium | /alerts?severity=medium | Alerts — Severity Levels |
Region B: Navigation Sidebar
Collapsible navigation providing access to all MiningOS modules.
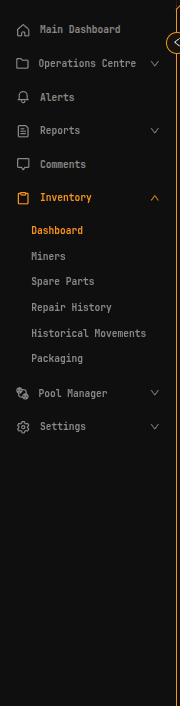 Figure 3: Navigation sidebar with Inventory module expanded
The Inventory section expands to reveal sub-pages:
| Sub-page | Purpose | Documentation |
|---|---|---|
| Dashboard | Site overview and miner distribution summary | This page |
| Miners | Individual device listing and management | Miners Inventory |
| Spare Parts | Replacement component inventory | Spare Parts Inventory |
| Repair History | Maintenance and repair records | Repair History |
| Historical Movements | Equipment transfer logs | Historical Device Movements |
| Packaging | Shipping and packaging management | Packaging |
Other top-level modules visible in the sidebar:
| Module | Documentation |
|---|---|
| Main Dashboard | Dashboard |
| Operations Centre | Explorer |
| Alerts | Alerts Manual |
| Comments | Comments |
| Pool Manager | Pool Manager Module |
| Settings | Settings |
Region C: Main Content Area
Context-dependent workspace that changes based on the selected module and page.
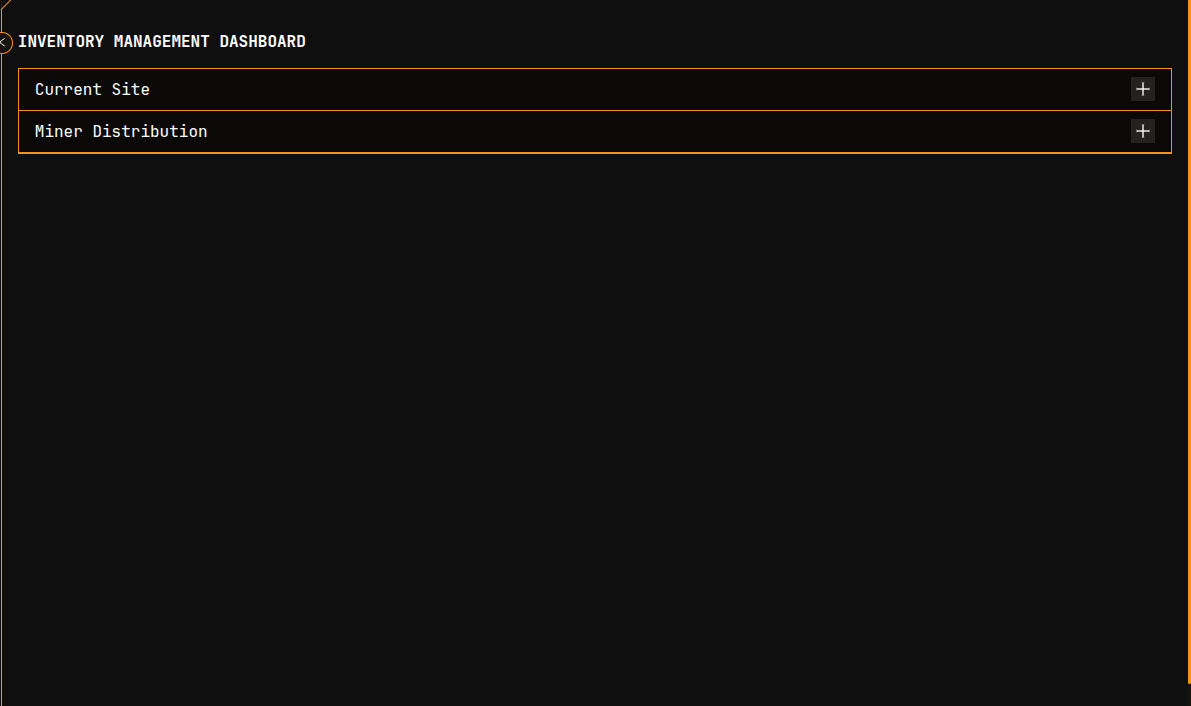 Figure 4: Main content area displaying the Inventory Management Dashboard
Inventory Management Dashboard
The default view when accessing the Inventory module presents two expandable accordion sections:
| Section | Description | Documentation |
|---|---|---|
| Current Site | Configuration and details for the currently selected mining site | Current Site Overview |
| Miner Distribution | Breakdown of miner allocation across containers and physical positions | Miner Distribution |
Both sections expand via the "+" button to reveal detailed content.
Data Refresh
Inventory data is refreshed based on the worker collection intervals configured during installation. For details on collection timing, see:
- Architecture — Data Flow — How data flows through the system
- Installation — Worker Configuration — Setting up collection intervals