Heatmaps
Visual temperature and performance monitoring to identify thermal hotspots and cooling inefficiencies.
Heatmaps provide visual temperature and performance monitoring for mining equipment, enabling operators to quickly identify thermal hotspots, cooling inefficiencies, and underperforming units. This feature is essential for maintaining optimal operating conditions and preventing hardware damage.
For system architecture and how temperature data is collected, see Architecture — Data Flow.
Accessing Heatmaps
- Navigate to a Container page (see Bitdeer Container or Antspace Hydro for examples)
- Select the Heatmap tab to view temperature and hashrate data
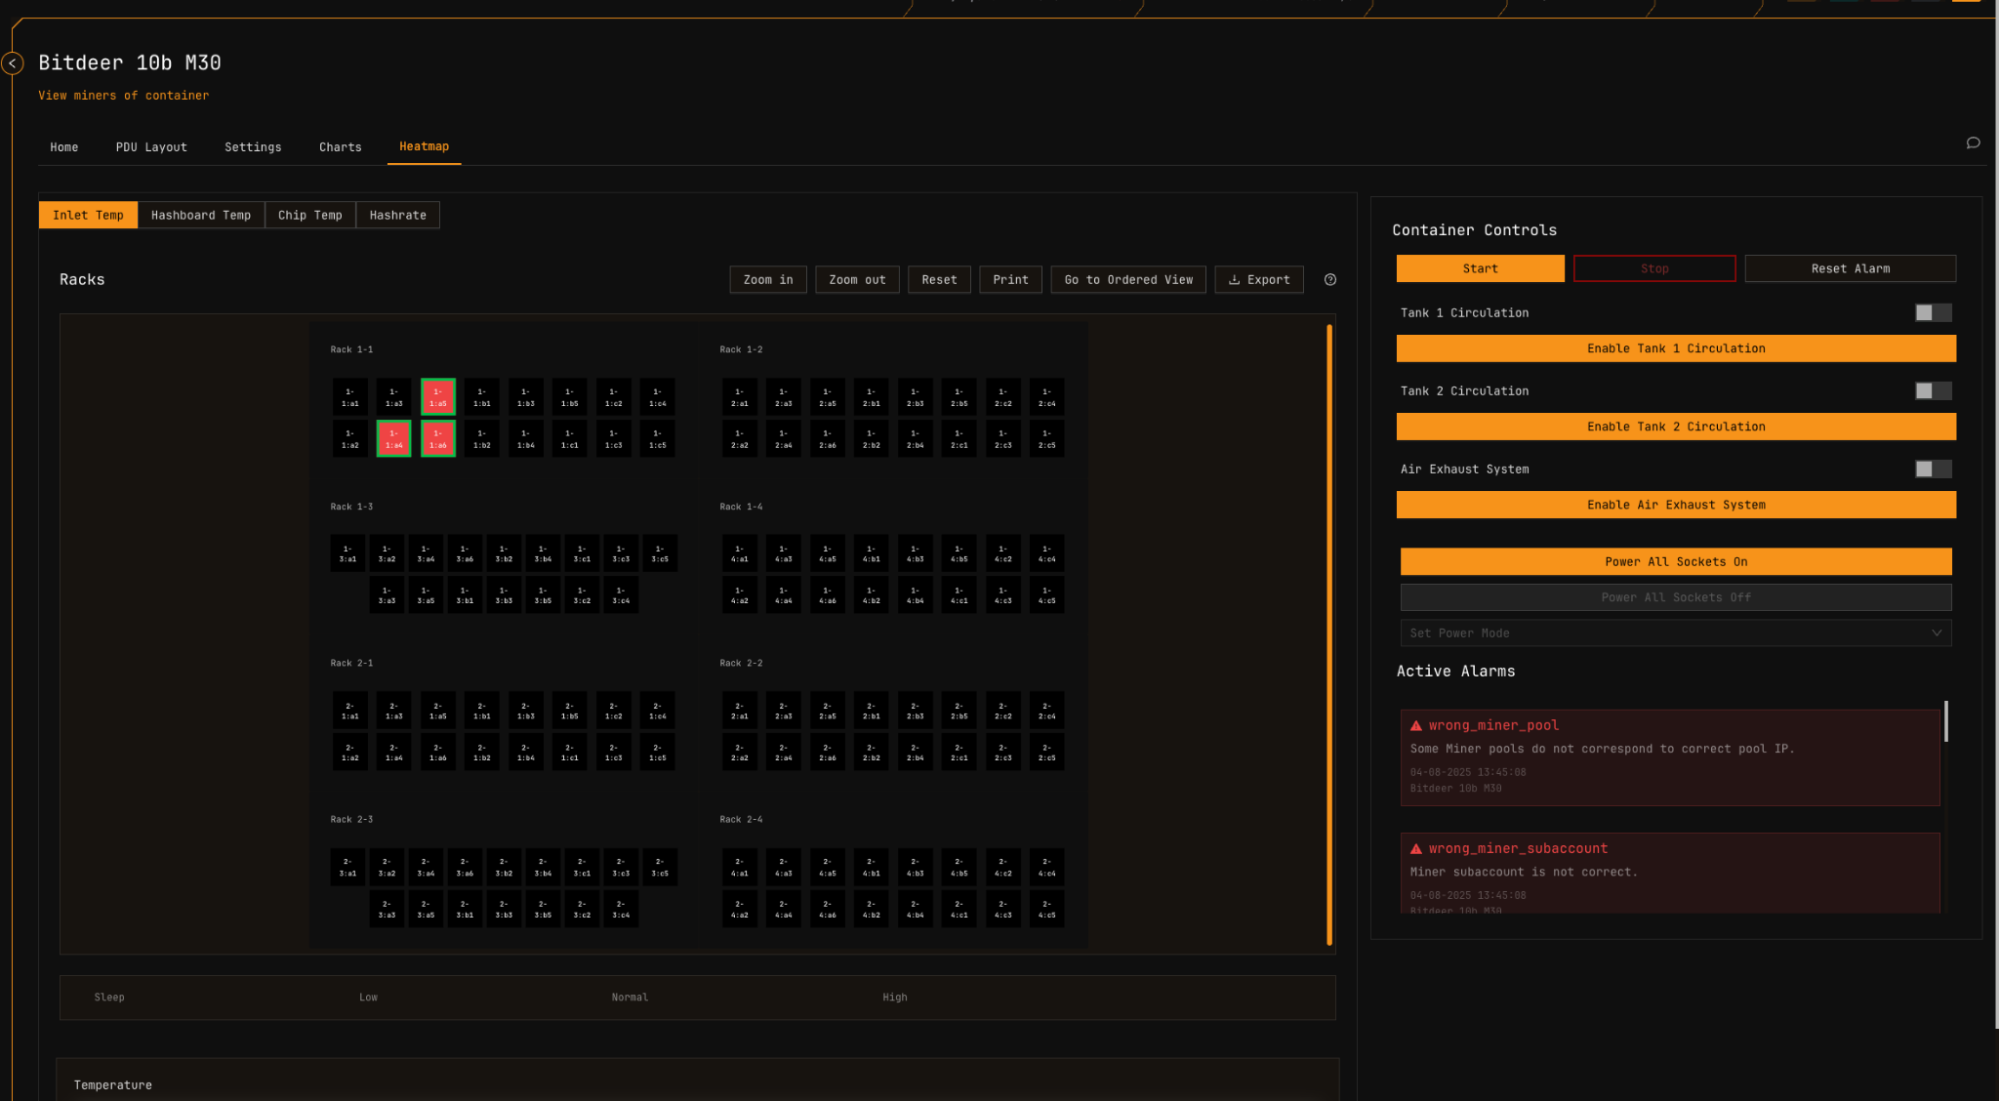
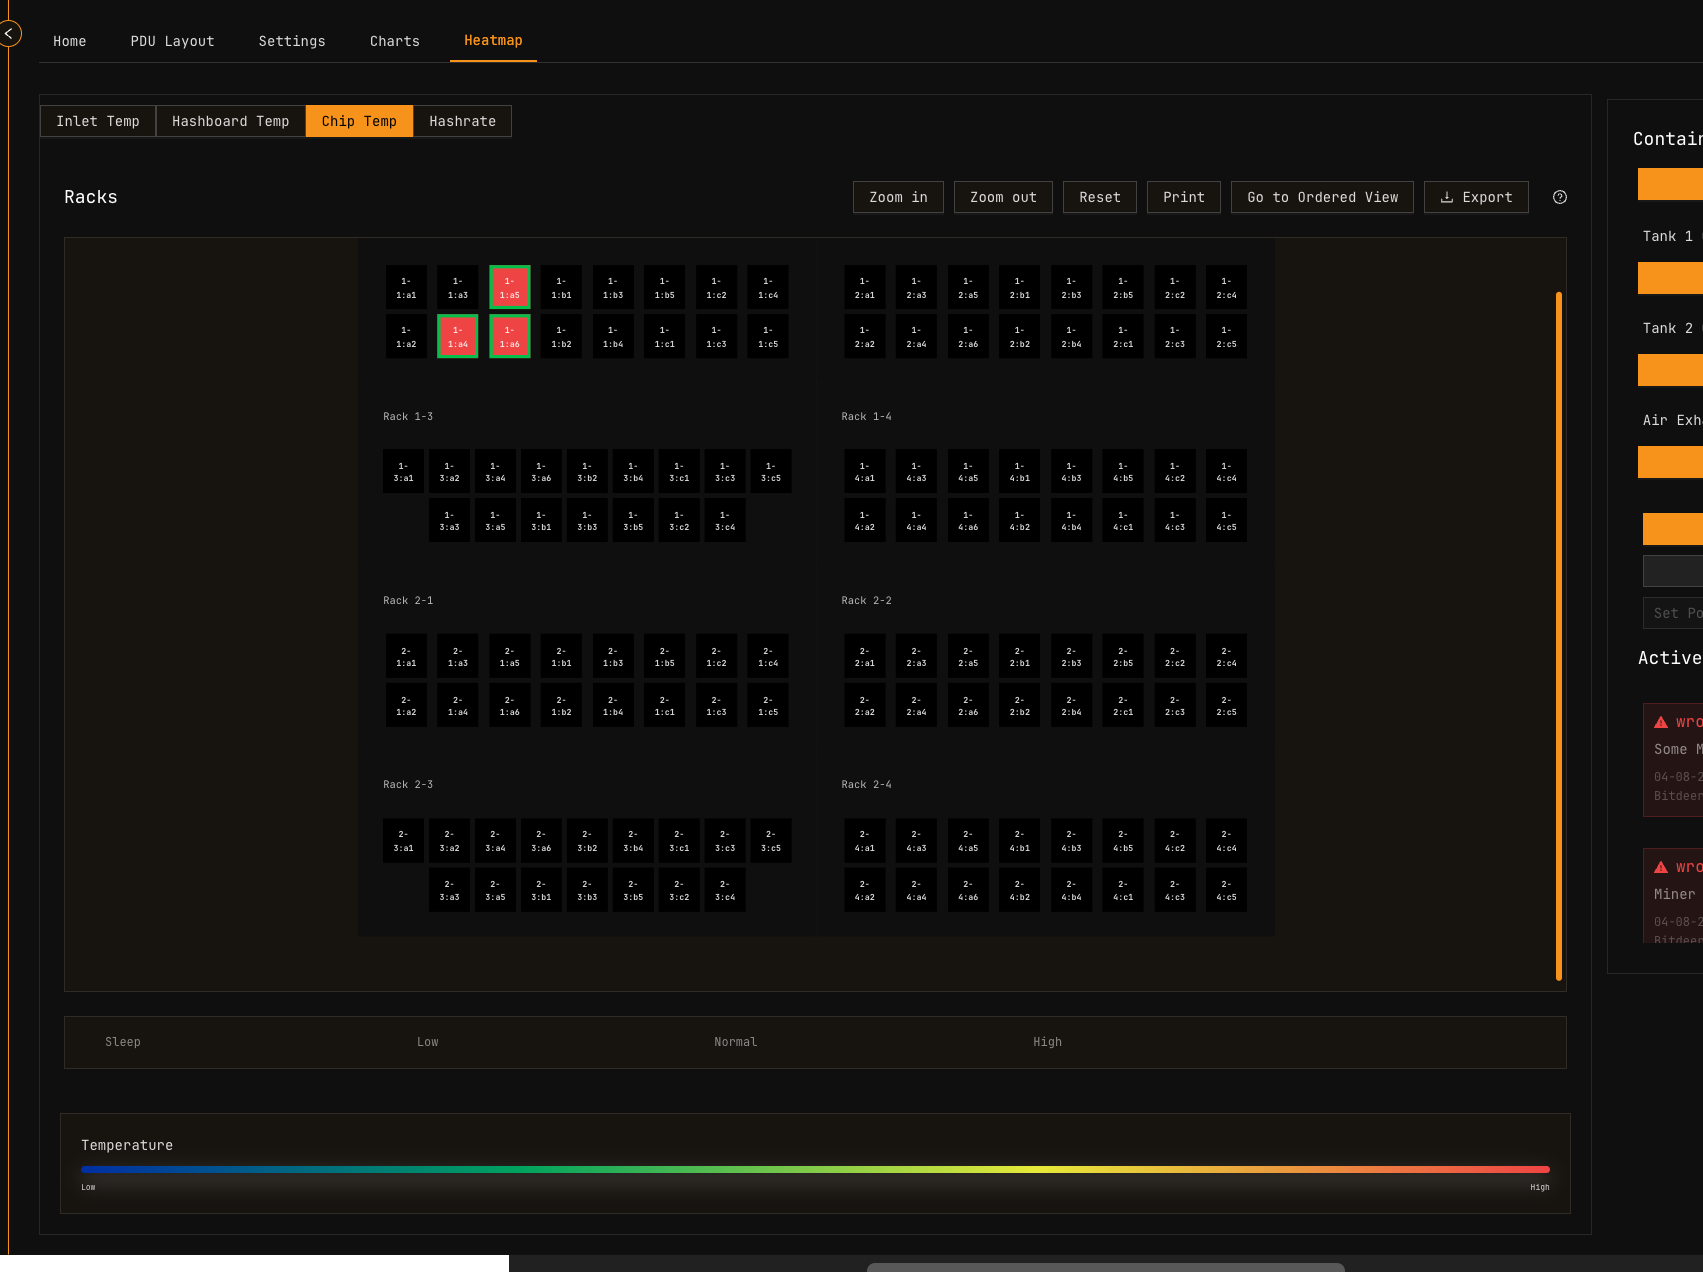
Miner Color Indicators
The heatmap uses a dual-color system to convey both power mode and thermal status simultaneously.
| Indicator | Represents | Reference |
|---|---|---|
| Border Color | Current power mode (High, Normal, Low, Sleep) | Power Mode Support Table |
| Fill Color Gradient | Temperature or hashrate value | See scale below |
Temperature Color Scale
| Color | Meaning |
|---|---|
| Red | Highest temperature — potential overheating risk |
| Orange/Yellow | Elevated temperature — monitor closely |
| Green | Normal operating range |
| Blue | Lowest temperature — cooler states |
For temperature alert thresholds and visual alerts by container type, see the Alerts Manual. For manufacturer-specified operating temperatures, see Supported Devices.
Temperature Metrics
MiningOS tracks three temperature measurement points for comprehensive thermal monitoring.
Inlet Temperature
The external cooling temperature provided to each miner, representing the effectiveness of the container's cooling system.
Hover over any miner to view its exact inlet temperature in real-time.
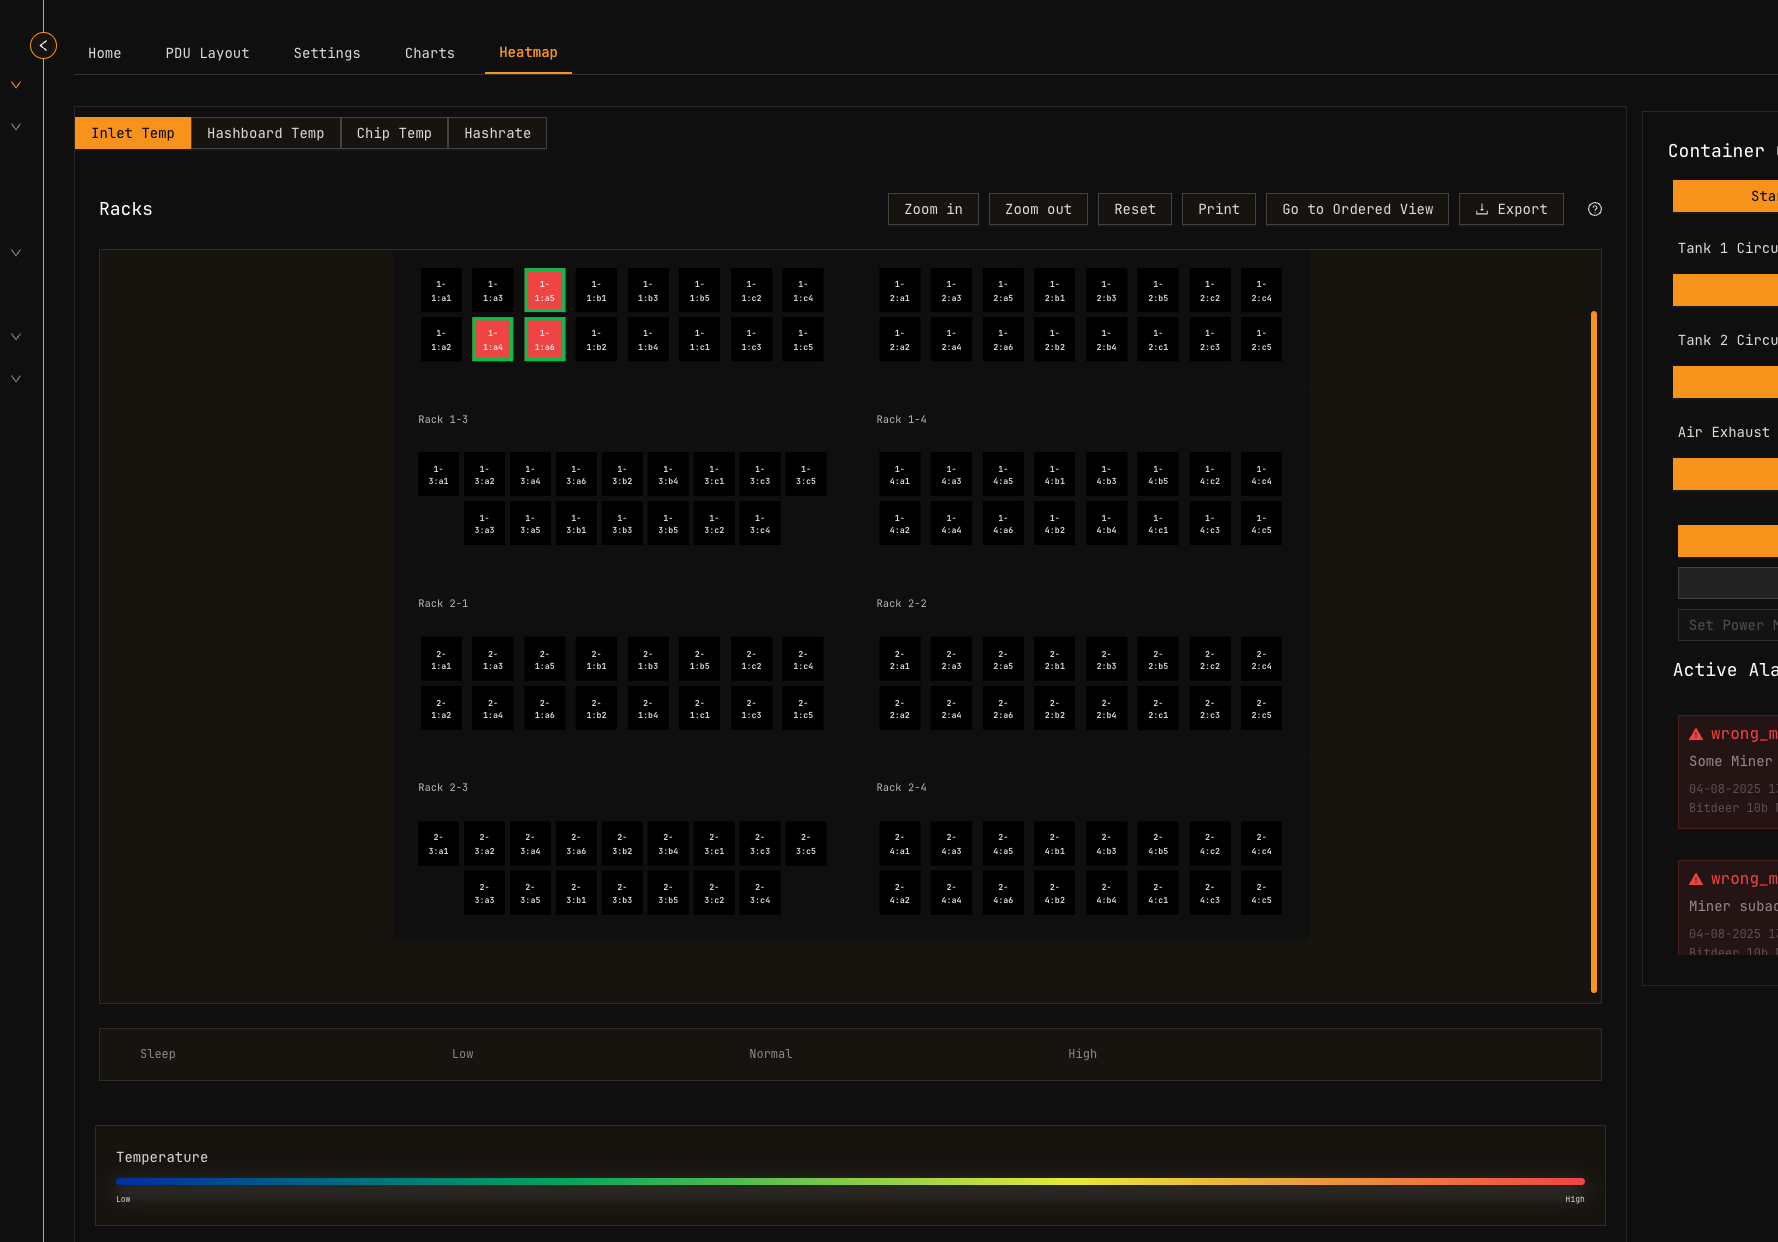
Hashboard (PCB) Temperature
The temperature of the Printed Circuit Board (PCB), critical for monitoring miner stability. Electronic components generate heat during operation, and excessive PCB temperatures can degrade performance and reduce component lifespan.
Hover over any miner to view its PCB temperature.
Chip Temperature
The operating temperature of the ASIC semiconductor chips inside each miner. Chip temperature directly affects mining efficiency and hardware longevity — operating within manufacturer specifications is essential for reliable performance.
Hover over any miner to view its chip temperature.
For manufacturer-specific temperature specifications and operating ranges, refer to:
- Supported Devices — Bitmain Antminer and Bitmain Support
- Supported Devices — MicroBT Whatsminer and MicroBT
- Supported Devices — Canaan Avalon and Canaan
Hashrate Metric
The Hashrate tab displays the processing power of each miner using the same grid layout.
Hashrate Color Scale
| Color | Meaning |
|---|---|
| Red | Highest hashrate — peak performance |
| Green/Yellow | Normal hashrate range |
| Blue | Lowest hashrate — potential issues |
Hover over any miner to view its precise hashrate value.
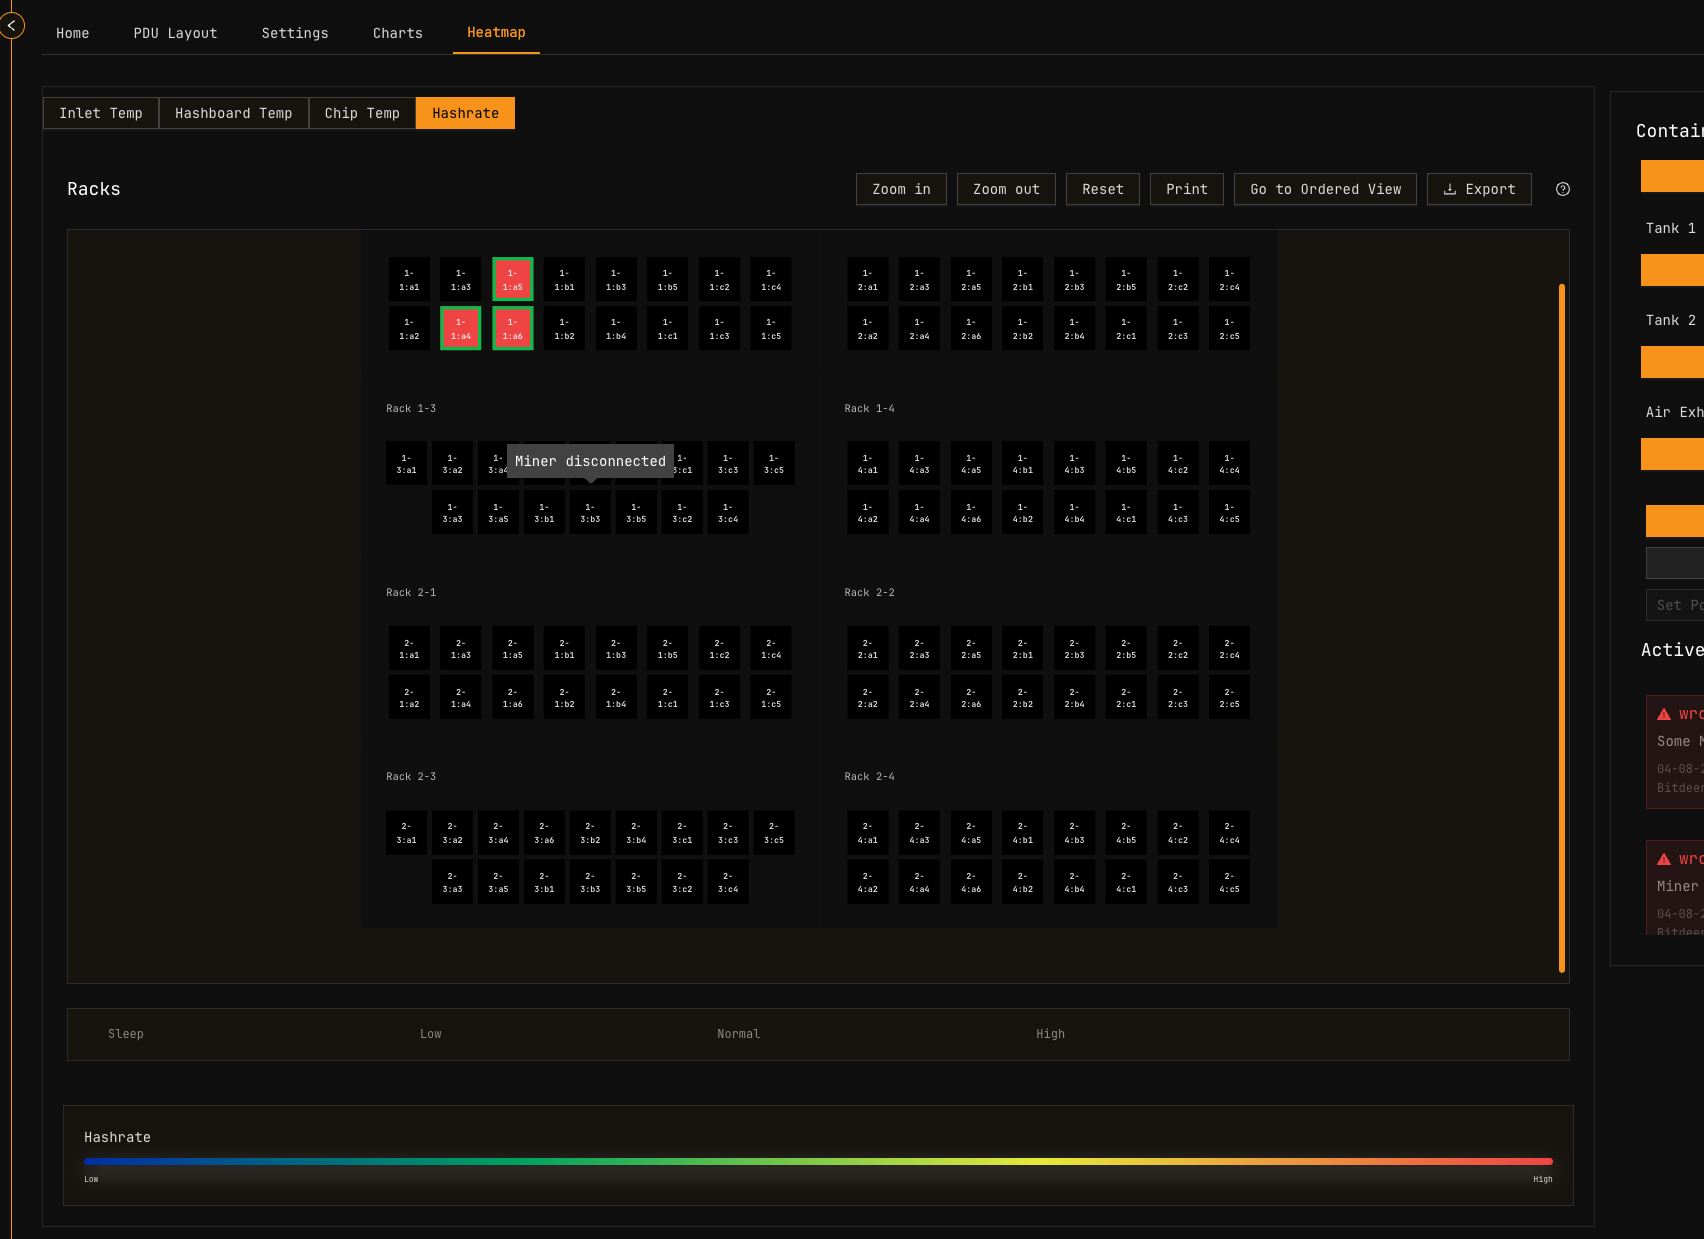
When a miner's hashrate is 0, its temperature is excluded from the PDU Layout views (Inlet temp, Hashboard temp, Chip temp). This prevents non-operating miners with much lower temperatures from skewing the color scale and making active miners appear falsely critical (red).
Interpreting Heatmap Patterns
| Pattern | Possible Cause | Action |
|---|---|---|
| Localized red cluster | Cooling system blockage or airflow restriction | Inspect physical cooling infrastructure |
| Entire row red | PDU-level cooling issue | Check rack-level cooling systems |
| Single red unit | Individual miner fault | Investigate specific miner via Explorer |
| Gradient from front to back | Normal airflow pattern (air-cooled) | Expected behavior |
| All blue with low hashrate | Miners in sleep mode or powered down | Verify intended state in Dashboard |
Related Documentation
Operator Manual
- Container Example: Bitdeer — PDU layout and container controls
- Container Example: Antspace Hydro — Hydro cooling monitoring
- Explorer — Device search and power mode management
- Alerts Manual — Temperature alert thresholds and severity levels
- Widgets Page — Container overview with temperature indicators
- Dashboard — Site-wide monitoring overview
Architecture & Technical Reference
- Architecture Guide — Data collection and aggregation
- Supported Devices — Miner temperature specifications