Header
The Header is the persistent navigation bar displayed at all times across all MiningOS pages. It provides real-time operational metrics, alert indicators, and quick access to pending actions.
For an overview of how these metrics are collected and aggregated, see the Architecture Guide.

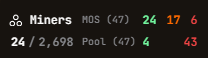
Miners Status Indicators
The Header displays the current count of miners organized by operational state:
| Indicator | Color | Description |
|---|---|---|
| Active miners / Total capacity | White | Miners with hash rate > 0 versus total container socket capacity |
| Online + Minor errors | Green | Miners operating normally or with non-critical issues |
| Major errors | Orange | Miners with errors affecting hash rate (shown in Orange if hashrate persists > 5 min) |
| Off + Sleep | Red | Miners that are powered off or in sleep mode |
For detailed miner status definitions and filtering options, see Explorer. For supported miner models, see Supported Devices.
Pool Connection Status
The Pool indicator compares MiningOS data with configured mining pool data:
- Green number: Miners actively connected and mining to pools
- Red number: Miners not mining or with pool connectivity issues
The subtotals between MiningOS and Pool may temporarily differ because data sources update at different intervals. For pool configuration and troubleshooting, see Pool Manager Module.
Hashrate Display
Displays aggregated hashrate from two sources for comparison:
| Source | Description |
|---|---|
| MiningOS | Hashrate collected directly from miner telemetry |
| Pool | Hashrate as reported by the configured mining pool |
Discrepancies between these values may indicate pool connectivity issues, rejected shares, or data synchronization delays. See Dashboard for historical hashrate charts. For details on how data is aggregated across workers, see Architecture — Data Flow.
Total Power Consumption
Power consumption in kilowatts (kW), updated every 5 seconds. The display color changes based on site-specific thresholds configured in backend settings:
| Color | Status | Action Required |
|---|---|---|
| Green | Optimal operational level | None |
| Yellow | Within acceptable range but below target | Monitor |
| Orange | Approaching lower operational threshold | Review power allocation |
| Red + Flash | Exceeding maximum threshold | Immediate attention—risk of penalties |
These thresholds are configured per site based on power purchase agreements and grid constraints. For power configuration, see Backend Operations. For power meter specifications, see Supported Devices — Power Meters.
Power Availability Forecast
Displays power availability for the current hour and next hour, always shown in the site's local time zone regardless of user timezone settings.
The Next Hour indicator flashes red when:
- Startup due: Current hour has 0 power available, next hour > 0
- Shutdown due: Current hour has > 0 power available, next hour = 0
Mining Efficiency
The efficiency metric is calculated as:
Efficiency (W/TH/s) = Total Power Consumption (W) / Total Hashrate (TH/s)Lower values indicate better efficiency. This metric helps identify:
- Equipment degradation
- Suboptimal environmental conditions
- Cooling system issues
For temperature-related efficiency analysis, see Heatmaps. For nominal efficiency values by miner model, see Supported Devices.
Alert Indicators
![]()
The Header displays the total count of active alerts organized by severity level. Clicking any alert indicator navigates directly to the Alerts page with that severity pre-filtered.
| Severity | Color | Description |
|---|---|---|
| Critical | Red | Requires immediate attention |
| High | Orange | Requires prompt attention |
| Medium | Yellow | Should be investigated |
For complete alert definitions and troubleshooting procedures, see Alerts Manual.
Actions Chart
![]()
The Actions Chart displays pending operations requiring attention:
| Color | Meaning | Action |
|---|---|---|
| Gray | Your actions pending submission | Review and submit when ready |
| Red | Your actions pending approval | Awaiting authorization from admin |
| Blue | Others' actions awaiting your approval | Review and approve or reject |
When an action completes, the counter decreases within seconds and a toast notification appears.
For detailed information on the authorization workflow, see Requests & Approvals. For user role definitions and permissions, see User Management.
Timezone Configuration
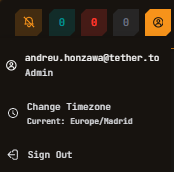
Users can configure their display timezone in the top-right corner. This setting affects how timestamps are displayed throughout MiningOS.
Timezone exceptions: The following elements always display in the site's local timezone regardless of user settings:
- Header: Power available in the next hour
- Reporting Tool: Weather forecasts