Alerts Manual
Guide to the MiningOS alerting system covering severity levels, UI locations, and container-specific indicators.
MiningOS provides a comprehensive alerting system to monitor mining operations and notify operators of issues requiring attention. This manual covers alert severity levels, locations within the UI, and container-specific visual indicators.
For operational guidelines on maintaining alert visibility, see Operational Best Practices. For how alerts are generated and processed through the system, see Architecture Guide.
Alert Severity Levels
MiningOS classifies alerts into three severity levels, each with distinct visual indicators and response expectations.
| Severity | Color | Description |
|---|---|---|
| Critical | Red (flashing) | Requires immediate attention; triggers audio notification |
| High | Orange | Lower severity than critical; requires prompt investigation |
| Medium | Yellow | Least severe; informational or minor issues |
Audio Notifications
Critical alerts trigger a buzzer sound on the Alerts Overview page. The buzzer behavior is controlled through the bell icon:
| State | Icon | Description |
|---|---|---|
| Buzzer active | 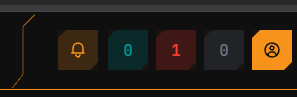 | Buzzer sounds when critical alert triggers |
| Buzzer on |  | Click to silence |
| Buzzer silenced |  | Silenced until new alarms trigger or user unmutes |
Alert Locations
Alerts appear in multiple locations throughout MiningOS to ensure visibility regardless of which page the operator is viewing.
Header Bar
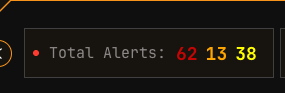
The Header displays total alert counts by severity. Clicking any severity icon navigates directly to the filtered Alerts Overview page.
| Color | Severity | Action |
|---|---|---|
| Red | Critical | Click to view critical alerts |
| Orange | High | Click to view high alerts |
| Yellow | Medium | Click to view medium alerts |
For complete header documentation, see Header.
Dashboard Active Incidents
The Dashboard displays recent alerts in the Active Incidents card. Clicking any alert navigates to that specific alert in the Alerts Overview page.
For dashboard details, see Dashboard.
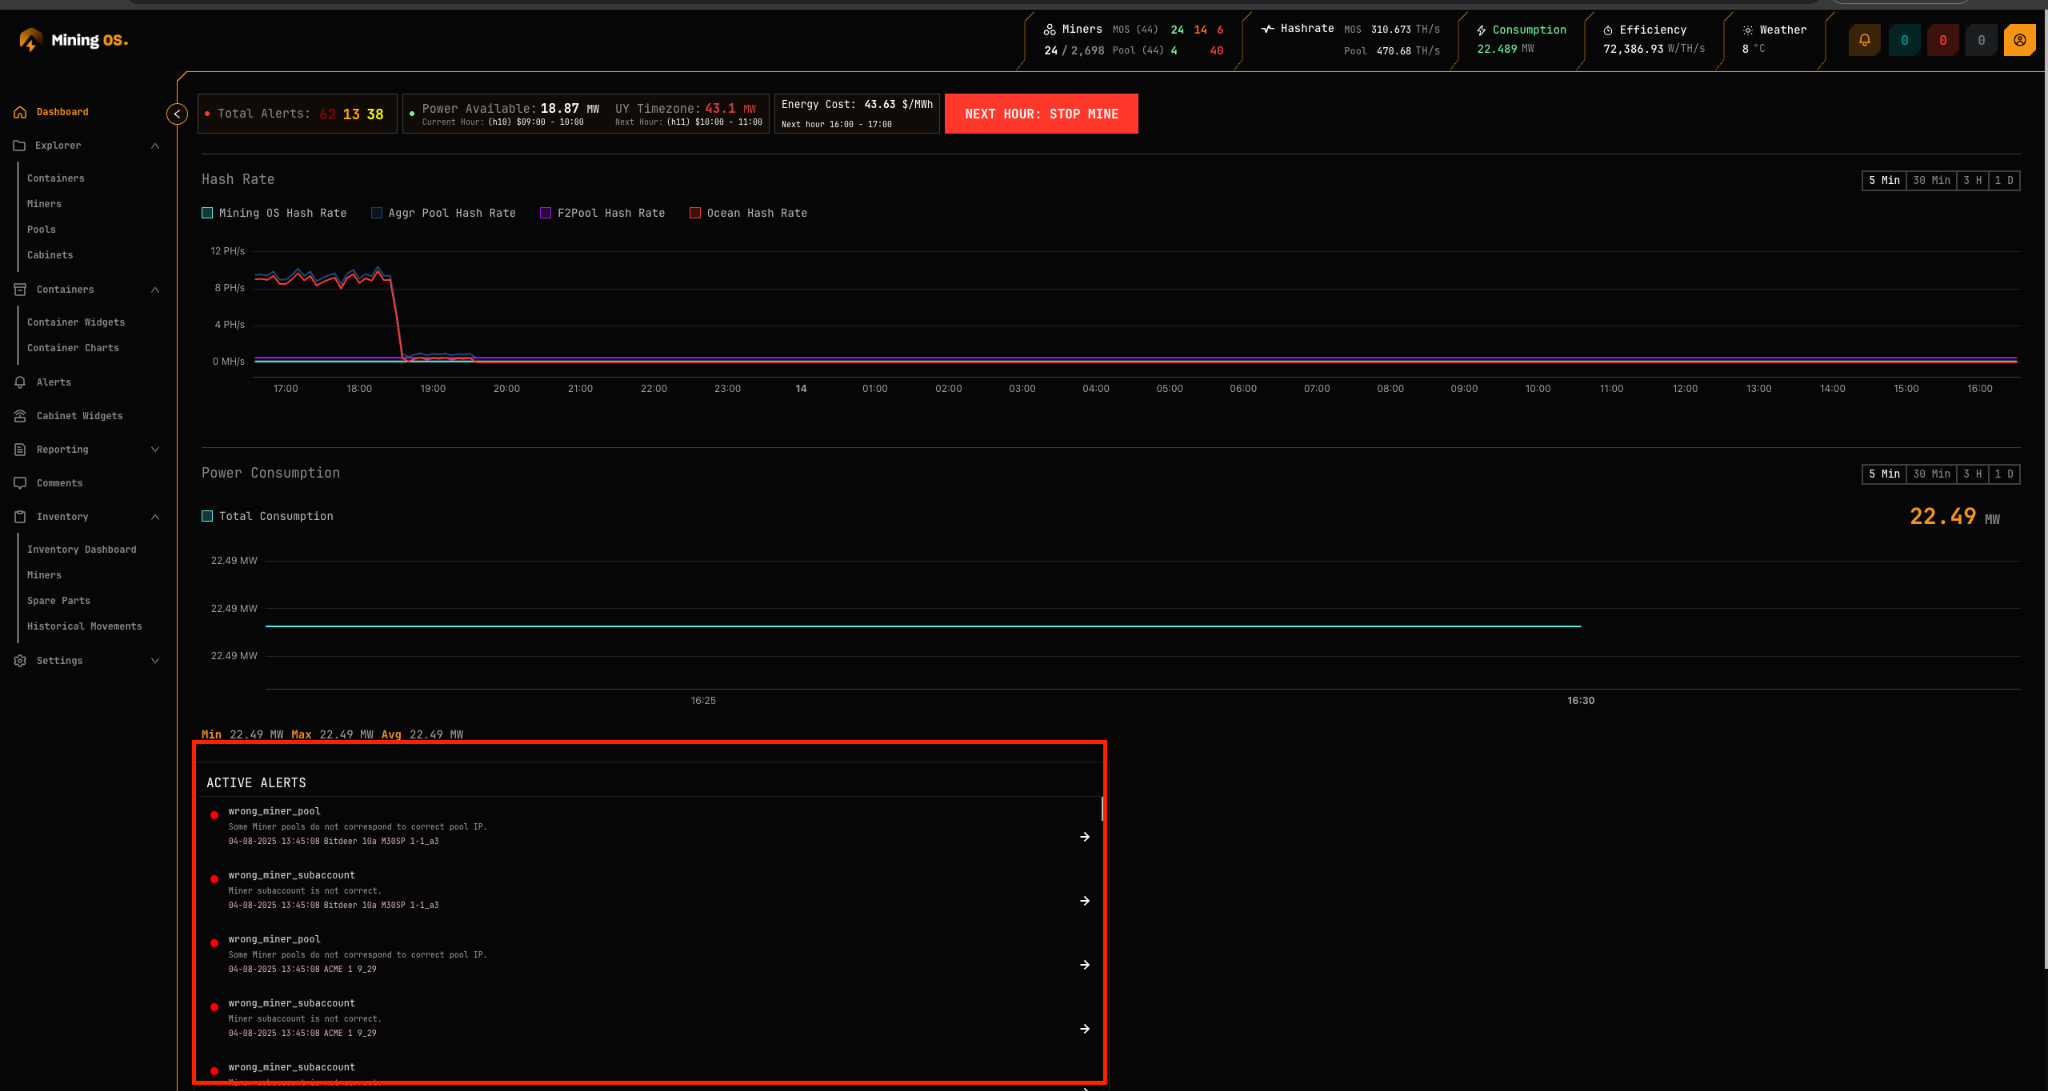
Alerts Overview Page
The primary alert management interface. Critical alerts trigger audio notifications only when this page is open in an active browser tab.
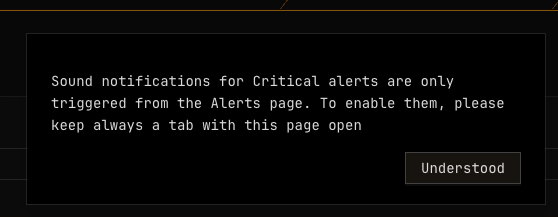
Recommendation: Keep this page open in a dedicated browser tab at all times. See Operational Best Practices.
Filtering Alerts
The filtering tool supports multiple criteria:
| Filter Type | Examples |
|---|---|
| Device type | Miner, Container, Power meter, Sensor |
| Severity | Critical, High, Medium |
| Miner status | Mining, Offline, Error, Sleep |
| Alert code | wrong_miner_pool, all_pools_dead |
| Tags | Same syntax as Explorer search |
Alerts Table
The table displays all site alerts with navigation to the affected device.
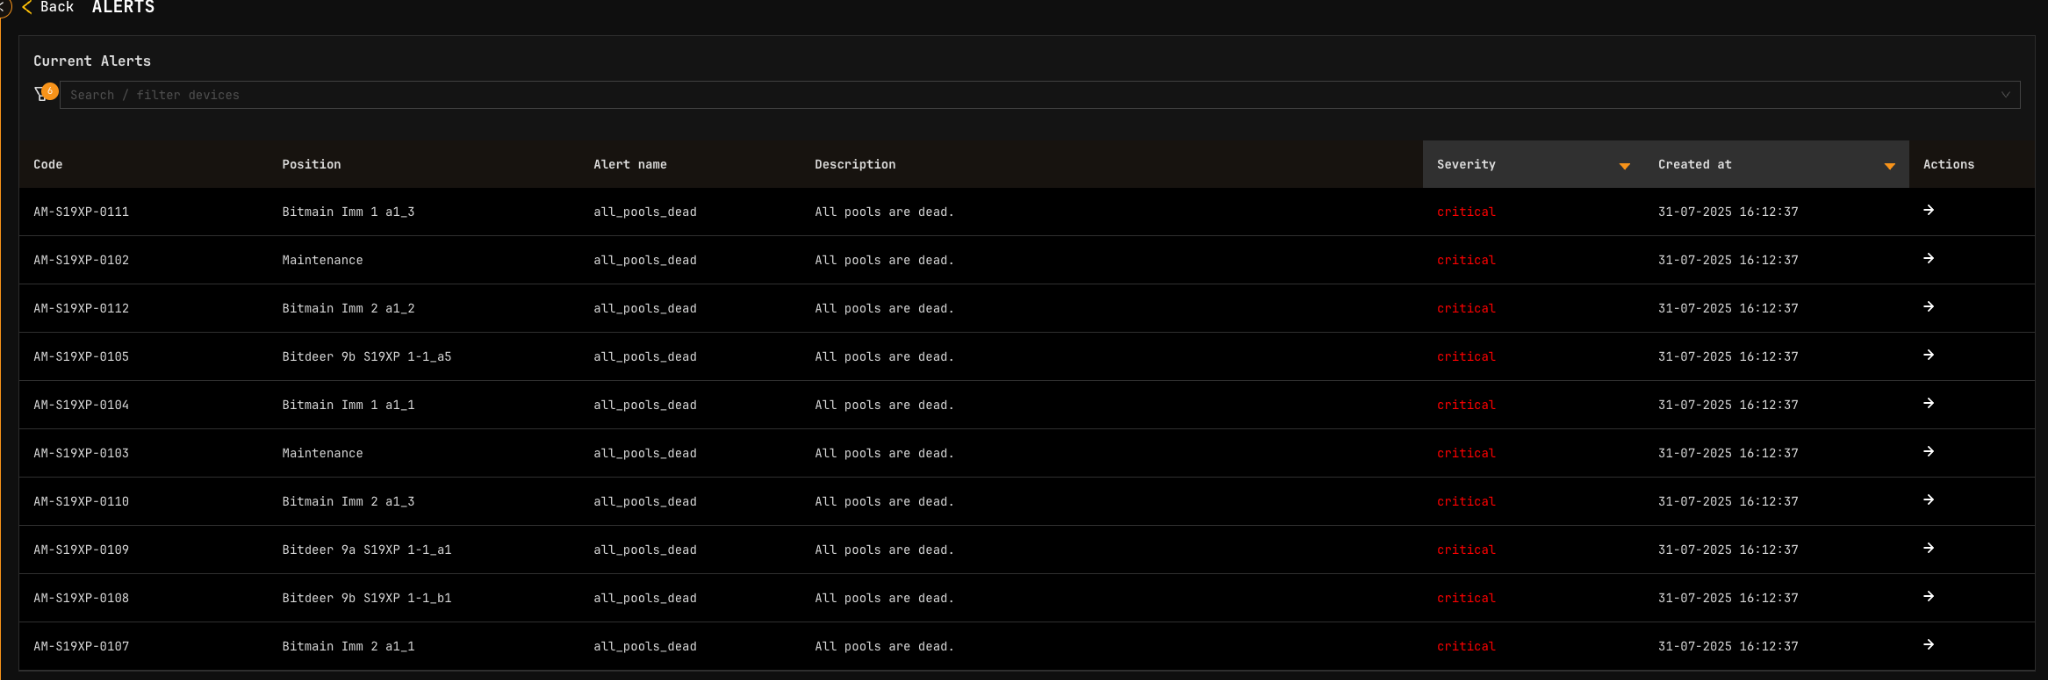
| Column | Description |
|---|---|
| Alert code | System identifier (e.g., wrong_miner_pool) |
| Description | Human-readable explanation |
| Severity | Priority level with color indicator |
| Timestamp | When the alert was triggered |
| Action | Navigate to device in Explorer |
Explorer Alerts
The Explorer displays alerts for selected devices.
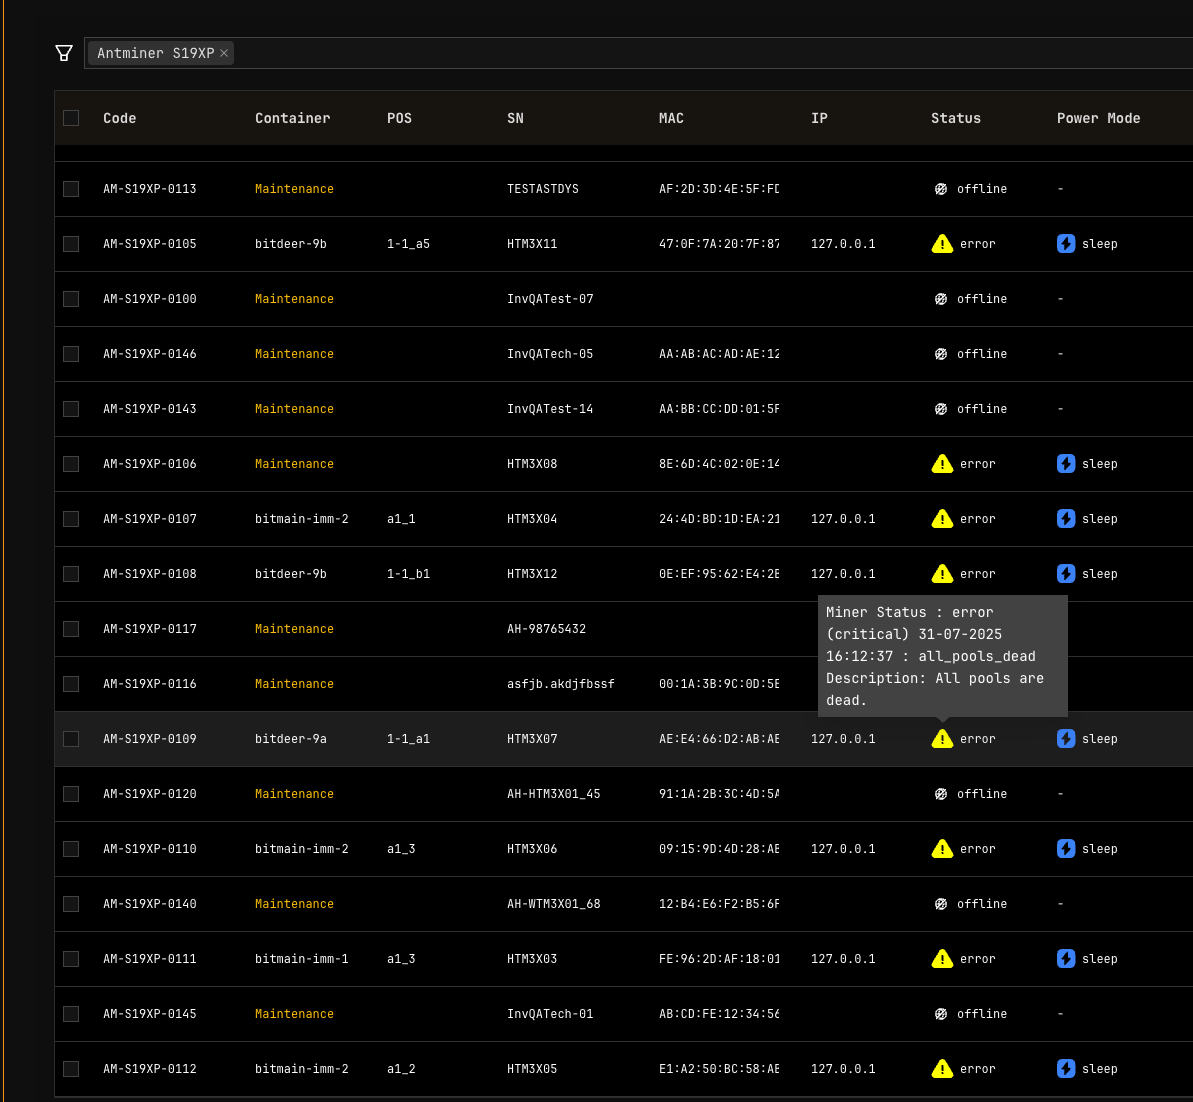
Miner Alerts
Error icons appear in the Explorer list for miners in error state. Hover to view error details.
![]()
Select a single miner to view its active alerts in the details panel.
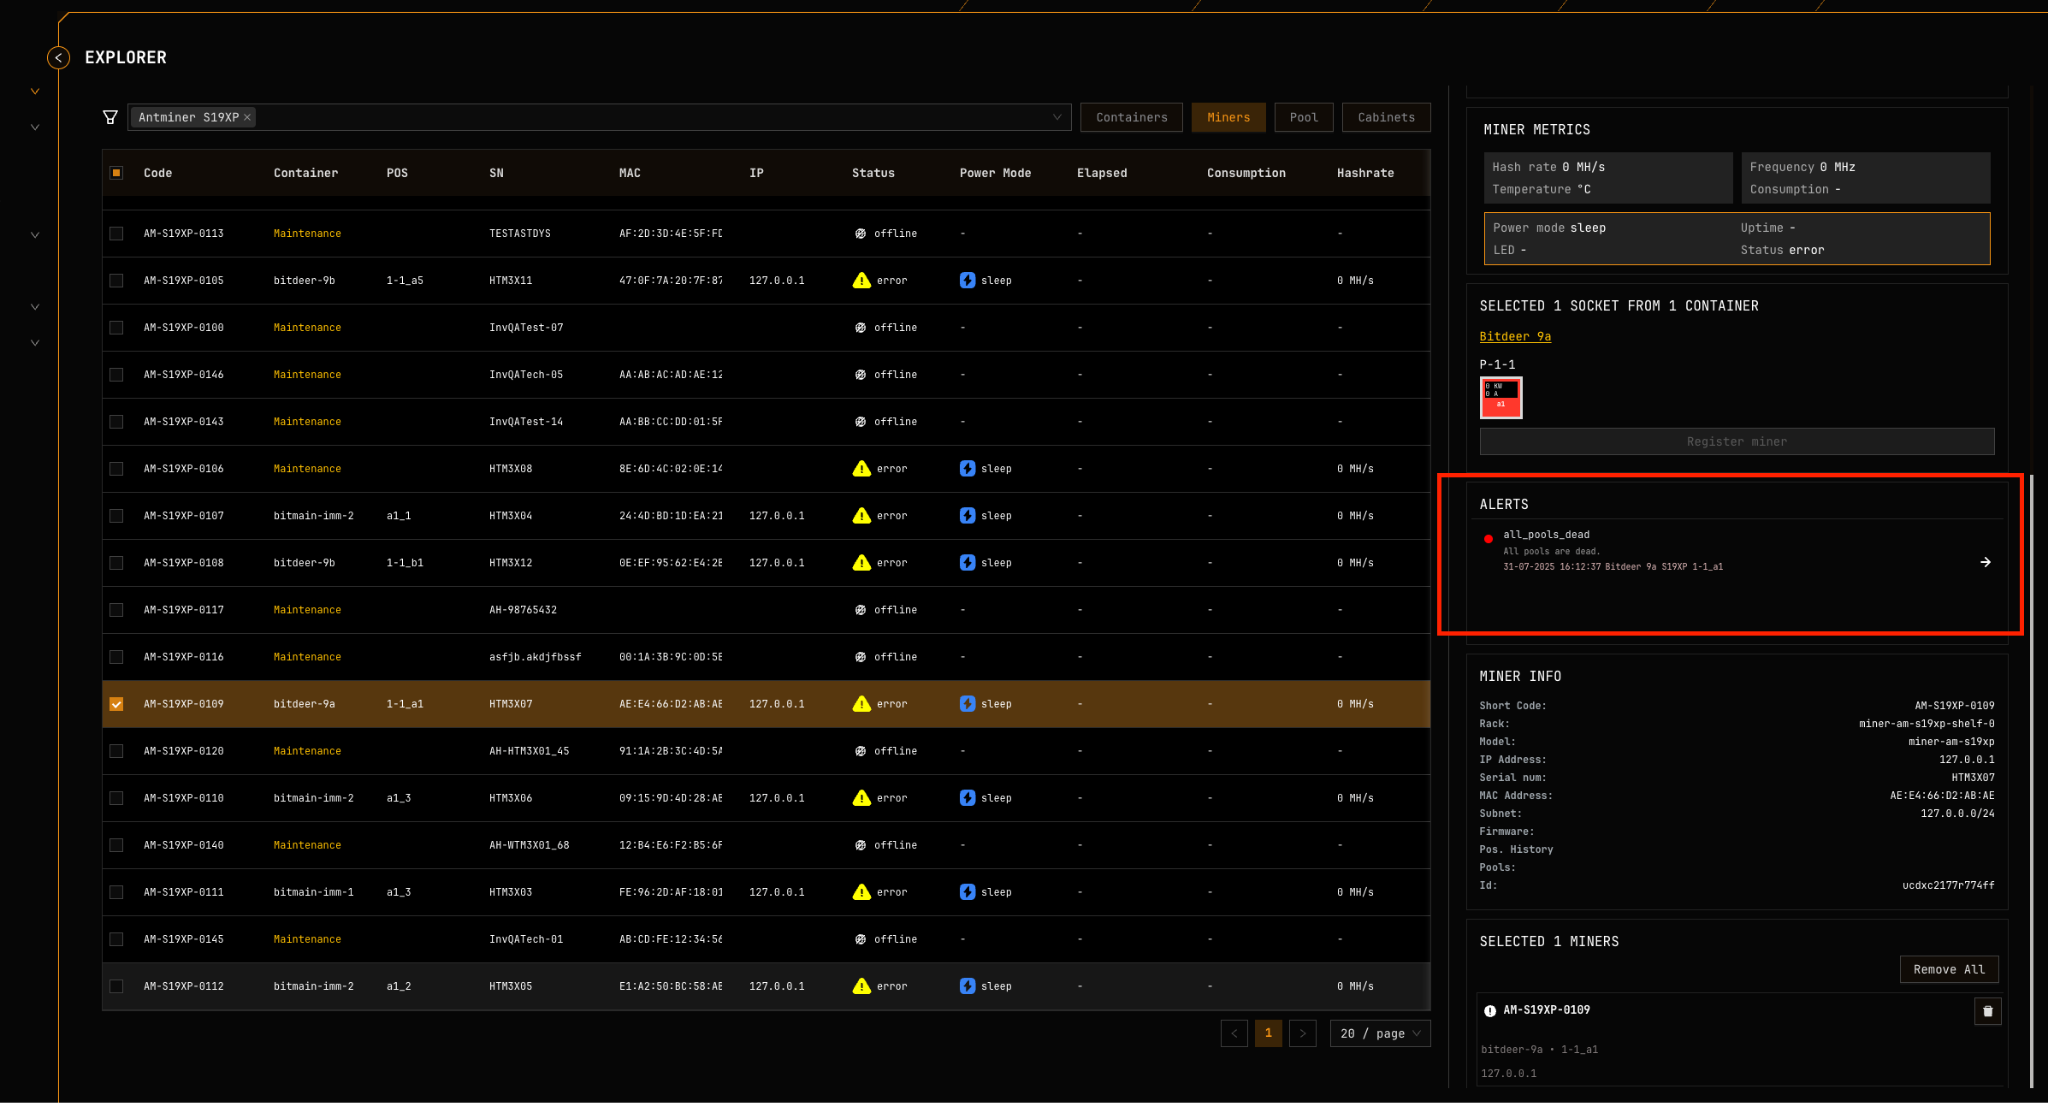
For miner selection and filtering, see Explorer.
Container Alerts
Hover over the alert icon in the Explorer list to view active container alerts. The Alerts card shows both container alerts and alerts from miners within that container.
Widgets Page Alerts
The Widgets Page displays alert icons on container widgets. Container names flash red when alarms are active.
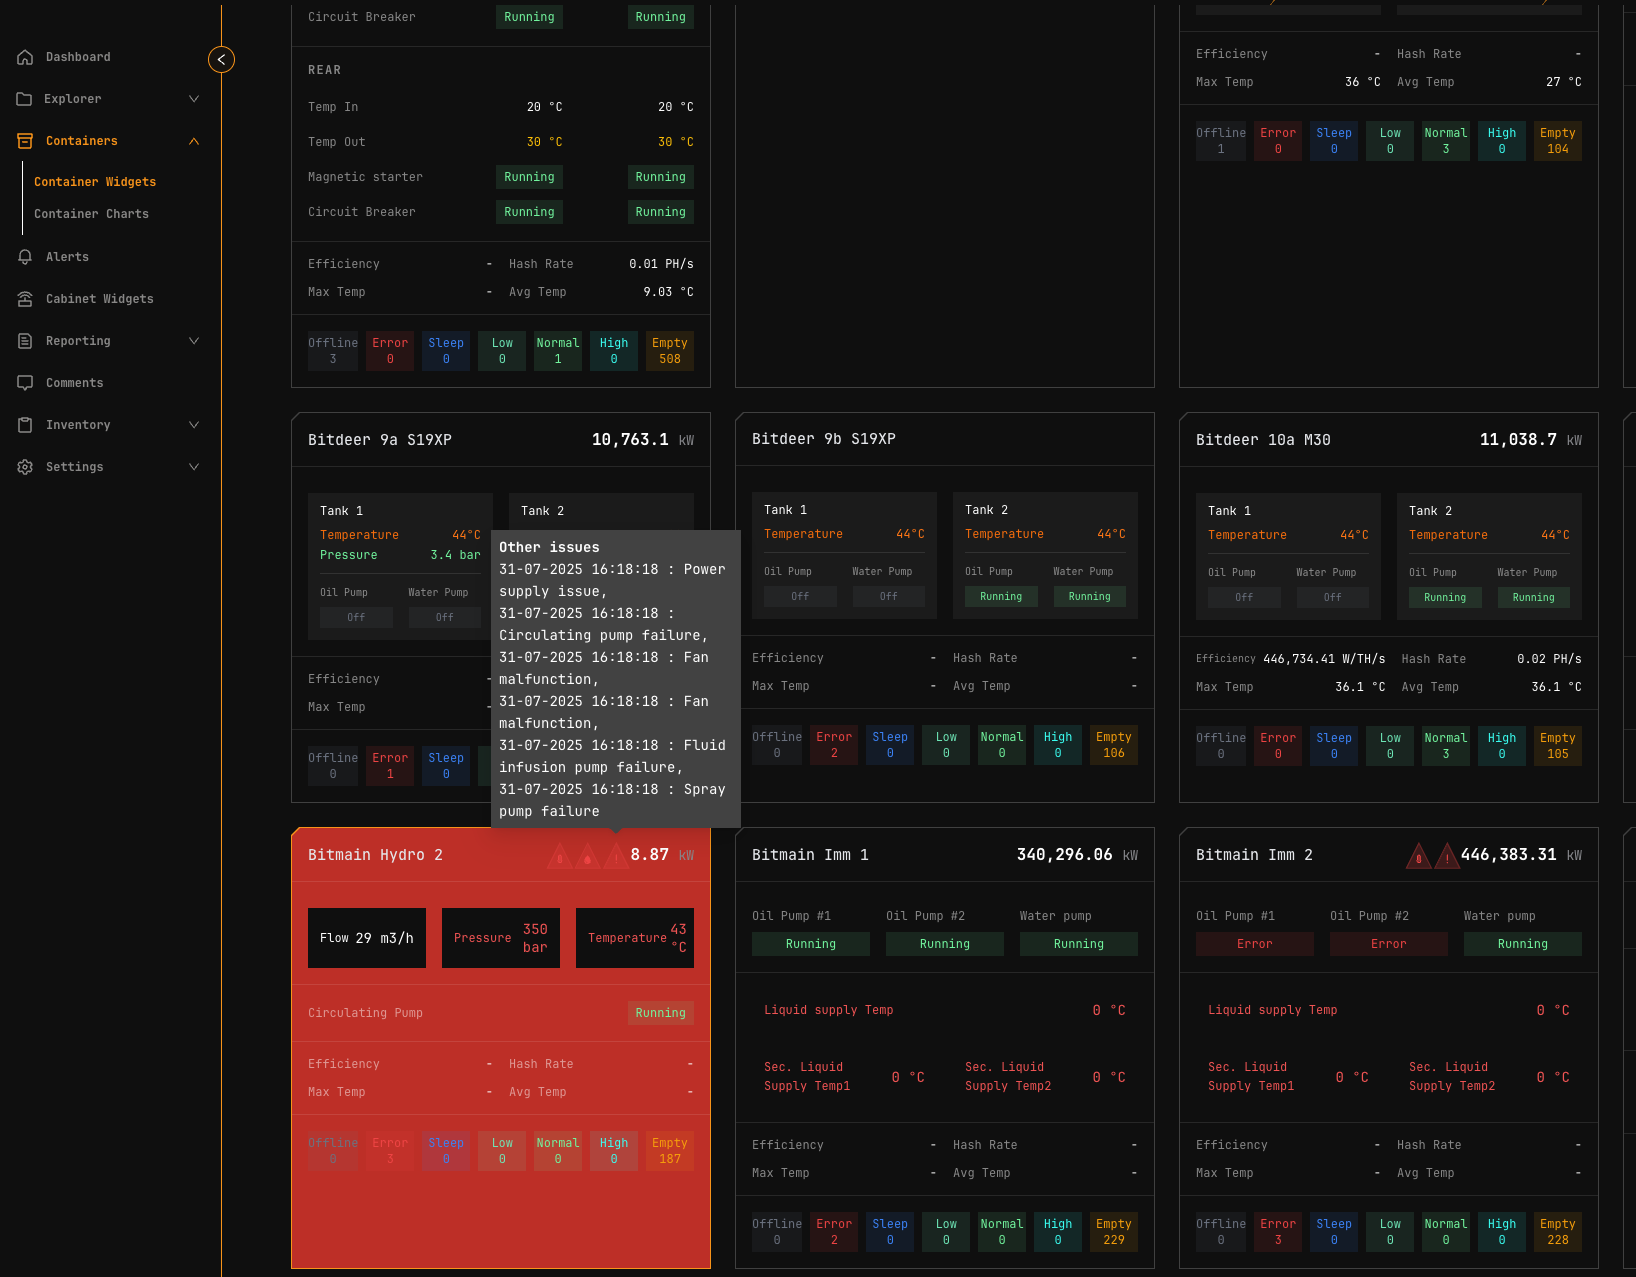
Hover over alert icons to view descriptions.
![]()
![]()
Container Detail Alerts
Container detail pages display alerts in the Alarms and Events section.
For container-specific interfaces, see:
Alert Reference
For a complete list of all MiningOS alerts organized by device type, refer to the Classes of Alerts by Thing reference document.
Common Alert Codes
| Alert Code | Description | Severity |
|---|---|---|
all_pools_dead | All mining pool connections failed | Critical |
wrong_miner_pool | Miner connected to incorrect pool | Medium |
wrong_miner_subaccount | Miner using wrong subaccount | Medium |
wrong_worker_name | Worker name doesn't match MiningOS ID | Medium |
ip_worker_name | Worker name contains IP instead of ID | Medium |
For pool configuration and monitoring, see Pool Manager Module. For pool worker setup, see Installation Guide.
Visual Alerts by Container Type
Each container type has specific temperature and pressure thresholds that trigger visual alerts. Thresholds are calibrated for the container's cooling system. For container specifications, see Supported Devices — Containers.
Color Progression
All container types follow a consistent color progression for temperature and pressure alerts:
| Color | Meaning |
|---|---|
| Green | Optimal operating range |
| Yellow | Suboptimal but acceptable |
| Orange | Warning—approaching limits |
| Red | Critical—immediate attention required |
| Red (flashing) | Critical with audio alert |
Bitdeer Containers
Documentation: Container Example: Bitdeer
Specifications: Supported Devices — Bitdeer Containers
Oil Temperature (L)
Temperature thresholds configured for optimal cooling system operation. Visual indicators progress from GREEN (optimal) through YELLOW/ORANGE (warning) to RED (critical) with flashing and sound alerts at critical thresholds.
Tank Pressure
Pressure thresholds indicate coolant system health:
| Indicator | Meaning |
|---|---|
| Green | Normal operating range |
| Red (low) | Potential leaks or insufficient coolant |
| Red (high) | Potential blockages or system faults |
Immersion Containers
Monitors Pri. Liquid supply Temp, Sec. Liquid supply Temp1, Sec. Liquid supply Temp2, and Sec. Supply Liquid Set Temp.
Oil Temperature (Sec. Supply 1 & 2)
Temperature monitoring follows similar patterns to Bitdeer containers, calibrated for immersion cooling systems. Visual indicators progress from RED (too cold) through YELLOW (suboptimal) to GREEN (optimal) and back through ORANGE to RED (overheating).
Note: Widget flashes red for circulating_pump_fault alerts.
MicroBT Containers
Specifications: Supported Devices — MicroBT Containers
Water Temperature (Unit Inlet Temp T2)
Water cooling thresholds calibrated for water-based heat exchange. Visual indicators follow standard progression with flashing and sound alerts at critical levels.
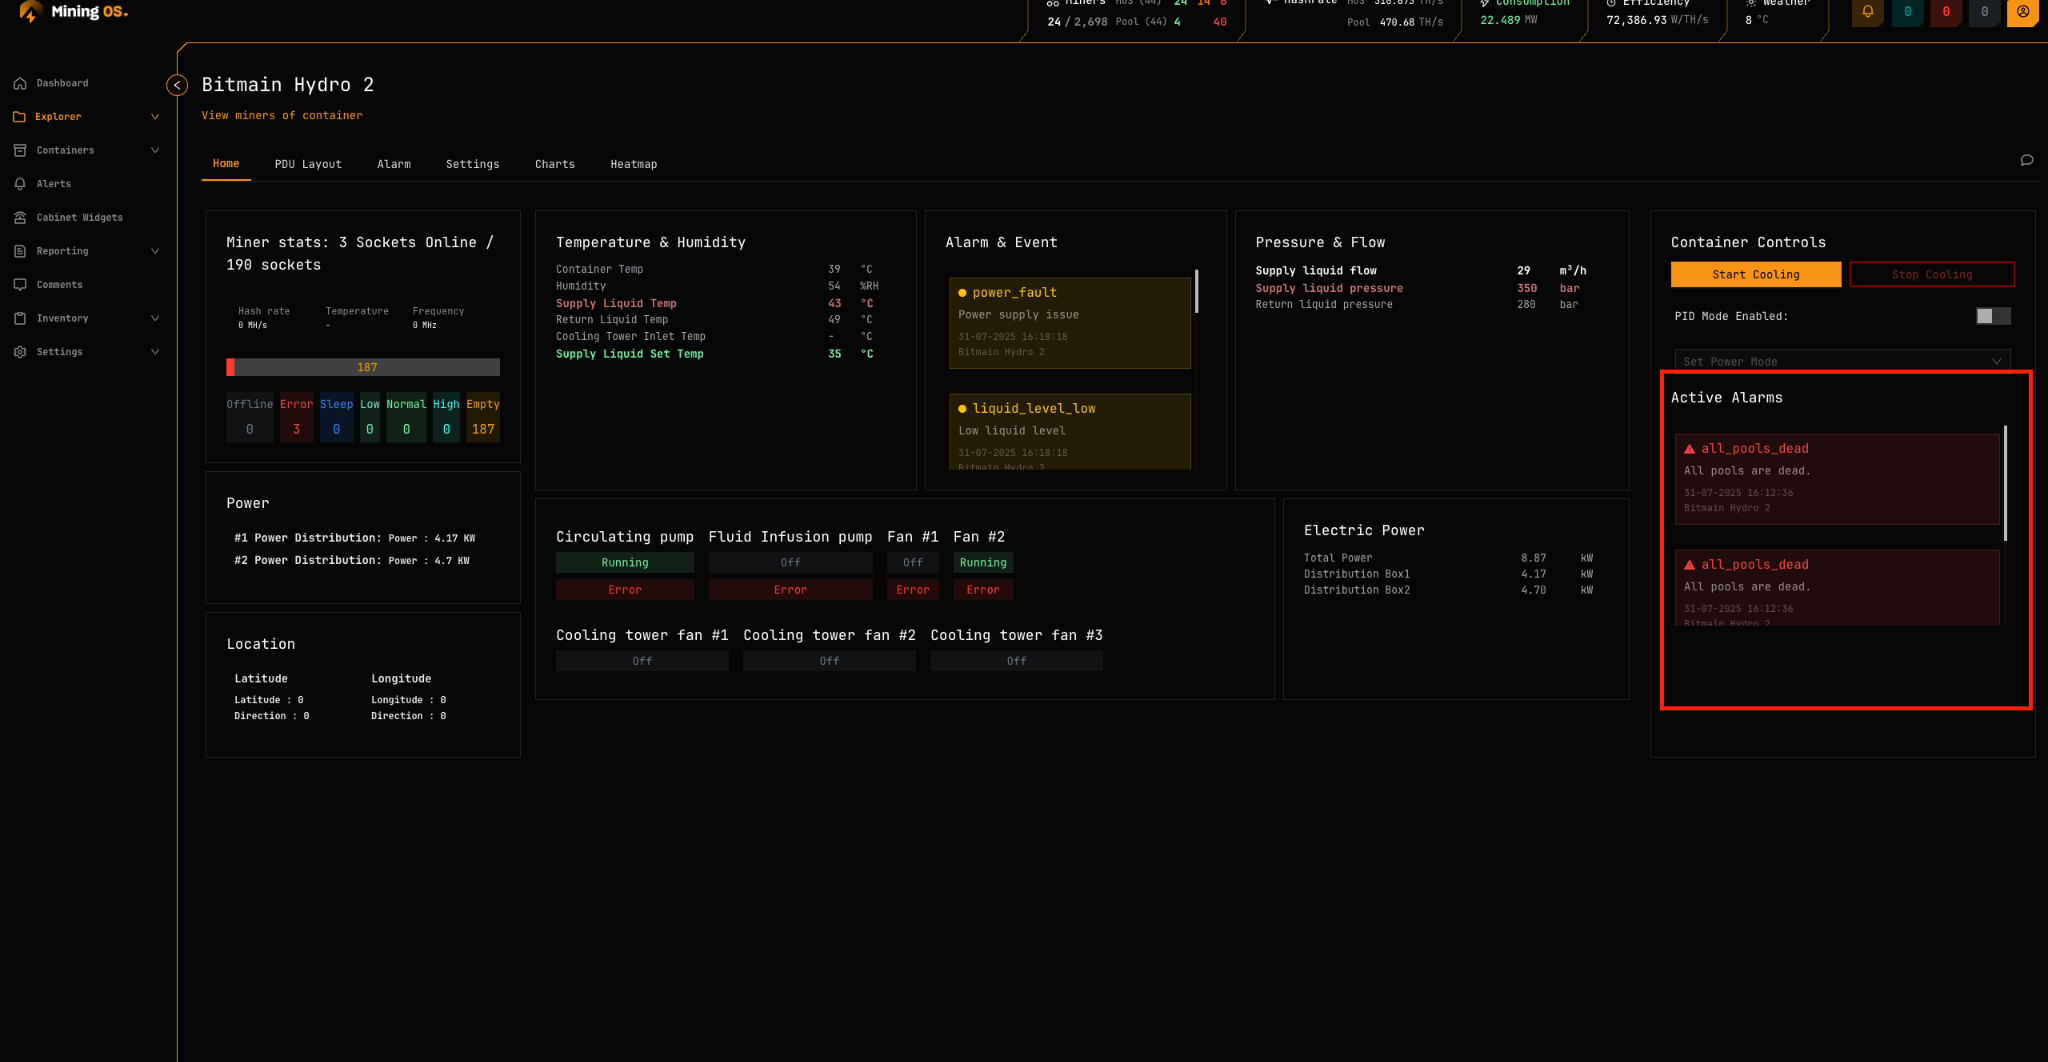
Bitmain Hydro Containers
Documentation: Container Example: Antspace Hydro
Specifications: Supported Devices — Bitmain Antspace
Water Temperature
Monitors Supply Liquid Temp and Supply Liquid Set Temp. Thresholds specific to Bitmain Hydro cooling architecture with enhanced visual and audio notifications at critical levels.
Supply Liquid Pressure
Pressure monitoring uses standard threshold logic:
| Indicator | Meaning |
|---|---|
| Green | Normal operation |
| Orange | Warning levels |
| Red | Critical low or high pressure |
Related Documentation
Operator Manual
- Header — Alert counts and quick navigation
- Dashboard — Active Incidents card
- Explorer — Device-level alert viewing
- Widgets Page — Container alert overview
- Container Example: Bitdeer — Bitdeer alert interface
- Container Example: Antspace Hydro — Antspace alarm management
- Pool Manager Module — Pool-related alerts
- Operational Best Practices — Alert monitoring guidelines
- Comments — Adding notes to devices with alerts
Architecture & Technical Reference
- Architecture Guide — Alert processing and data flow
- Supported Devices — Container and device specifications
- Installation Guide — Worker setup and alert configuration